Hurricanes
Everyone knows that hurricanes are one of the most destructive forces on the planet. How can we use technology to help aid in advanced warning and potentially save lives? I decided to get my feet wet and build a neural network that classifies storms based on the following parameters: latitude, longitude, month, pressure, wind speed and time of day.
Overview
I started out naively thinking that I could just toss this data into my neural network and it’d learn the formula for storm classification. Well, it wasn’t quite that easy. There were a few stumbling blocks along the path that I had to overcome in order to boost my accuracy to create a useful classifier.
Mining Op.
All my source code can be found in my Github repo. I used Python, Pandas, Numpy, Matplotlib, Jupyter, graphviz, Ann Visualizer, seaborn
Dataset
My dataset was a curated one from kaggle. My goto source for fun and interesting datasets.
Model creation
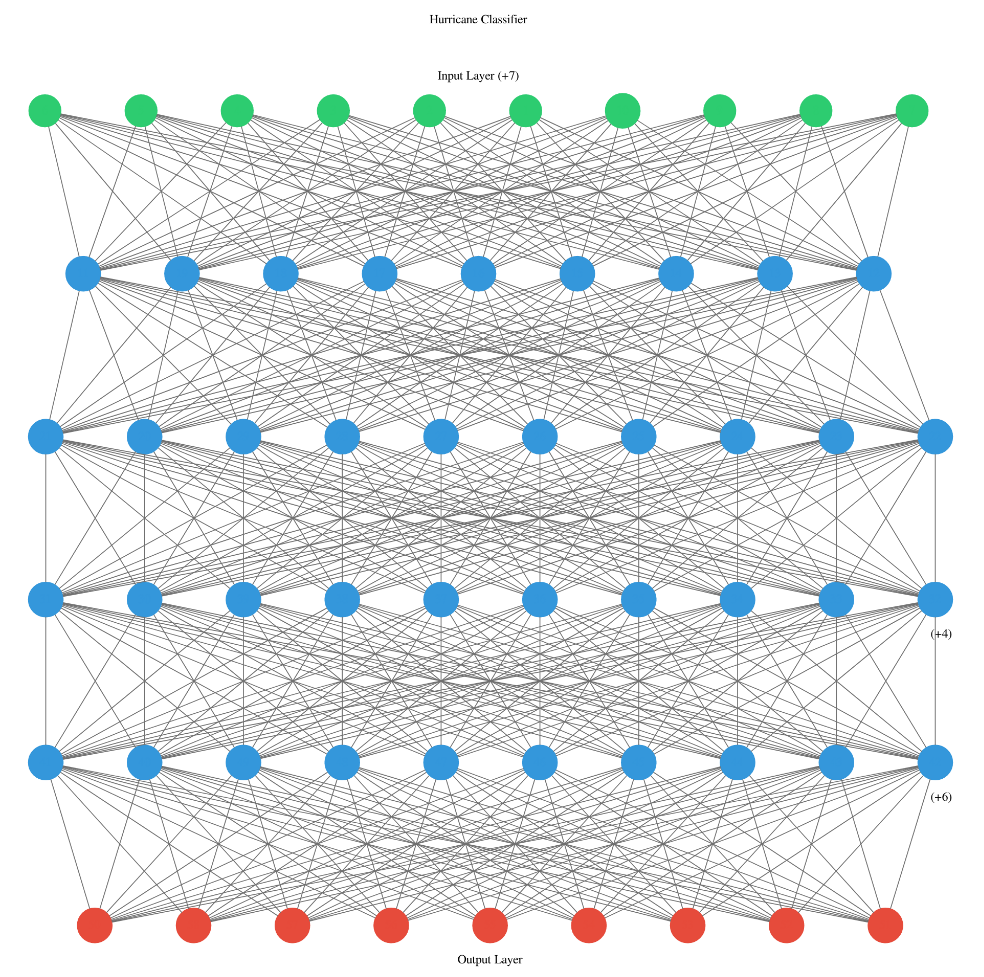
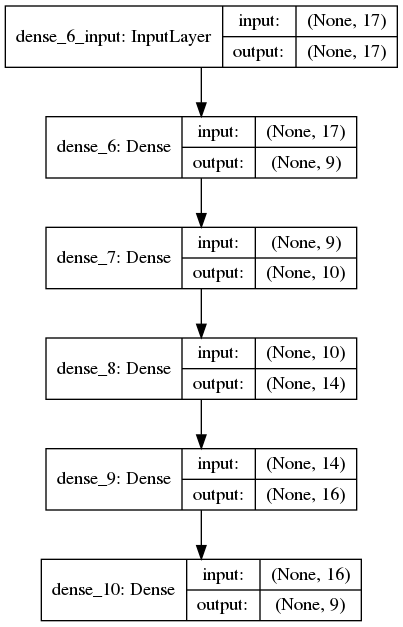
I played around with it and found the best performance from the multi-layered neural net with 18 input features and 9 output features. I won’t explain what is obviously observed from the following images. A picture makes the complicated much more consumable, occasionally.
This is a fun visualization of the network using “Ann Viz”. It works well. It’s basic however it’s simple and easy to use.

The following image shows a little more detail. This is more useful than above. However it does leave something to be desired regarding coloring and labeling.

latitude and longitude
There are various ways of handling these data points. At first I contemplated making dummy variables for all the combinations of latitude and longitude and then just settling on a huge feature set consisting of a large sparse matrix. After attempting this and watching my features grow from 8 to nearly 1000 I took this back to the drawing board. I did a little research and found that the best method is to map the latitude and longitude onto a x,y,z cartesian coordinate system.
The actual mapping is quite simple. I converted the latitude and longitude through three simple functions.
R is the radius of the earth in kilometers (6371)
x = R * (cos(lat) * cos(long))
y = R * (cos(lat) * sin(long))
z = R * sin(lat)
Feature Selection
This was the most difficult part. I began curating this dataset many weeks prior to any actual results. I struggled with knowing what to do with the time, date, latitude and longitude. I didn’t know if I should “one shot hot encode” everything into dummy variables or remove the features entirely.
After looking over the dataset I decided that the most significant records only utilized the times, 0600, 1200 and 1800. Very few had time measurements beyond the aforementioned ones. I completely disregarded the ocean the storm was in i.e., Atlantic, since I already had global positioning data. I also threw out the name of the storm.
I noticed that most of the earlier dates had next to no pressure and wind speed measurement. I excluded all data that had garbage measurements. The pressure was measured as being -999 for older storm systems. This is due to older equipment that didn’t have the sensitivity to record meaningful data. In the software world we use the adage “garbage in, garbage out.” I excluded these records and continued building the model without any series implications.
Performance
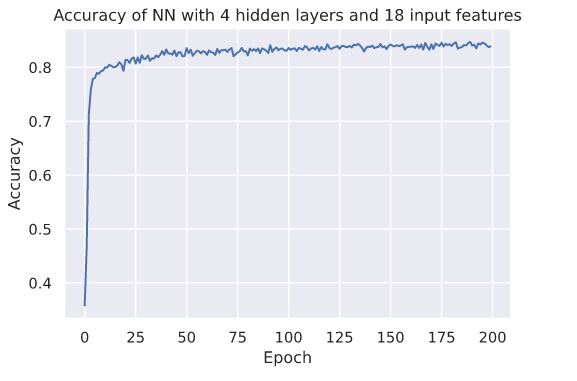
The accuracy of the network was admirable with ~85%. A little bit of research indicates that there is no formula to give you the optimum number of neurons per hidden layer. However there are some general guidelines. I decided to experiment with the number of neurons and ended up with this configuration yielding the best results.

Wrap up
In the end, the model did a decent job classifying hurricanes based on the 18 features. It’d be interesting to build another time series model and an LSTM layer or some other form of an RNN and see if it can predict a hurricane based on previous readings. I might end up doing that and if so I’ll update this exploration.
For now, this was a great exercise in feature encoding and data preparation. Sometimes all your time is spent in the data preparation stage and only a little bit of time is spent actually creating the model.
Sources
Banner and thumbnail taken from Alex Rommel